Visit the Atlas and explore the data: www.lhfatlas.org.uk
Introduction
The homelessness sector in London has had a year like no other. From acute anxiety and concern about those sleeping outside or in communal spaces as Covid-19 took hold, to the extraordinary efforts to support the ‘Everyone In’ directive, followed by the challenges of move on, and a cold snap with extended periods of Severe Weather Emergency Provision, 2020 was a year to remember.1
The LHF Atlas provides a unique overview of data about services for people experiencing or at risk of rough sleeping in the capital. In this second blog accompanying the latest release of the Atlas for 2021, we continue to tell the story of the last year though data. We take a bird’s-eye view of two core elements of the Atlas data presented each year: rough sleeping figures and supported housing and hostel accommodation mapping.
Rough sleeping figures
The Atlas presents two sets of rough sleeping figures by borough: the number of people contacted rough sleeping by outreach teams, which is data from CHAIN, and the street counts and estimates, which is data provided by local authorities and published by central government. You can view these on the London map and also view trends data for your area via the borough focus. The CHAIN annual figures are updated when new statistics are published, usually in June.

Street count and estimates figures were hot off the press from 25th February – we present these in the Atlas alongside last year’s data. The key trend to note in the street count and estimates figures is a significant (37%) reduction in November 2020 compared with the previous year (714 people down from 1,136). The only borough with more than 50 people seen on the November street count was Westminster, where 242 people were seen sleeping rough – still a sizeable reduction of 27% on the previous year.
Street count and estimates figures can be controversial and are often contested[1]; however, never (or perhaps very rarely) does anyone claim that these figures show the extent of rough sleeping comprehensively, or cover all groups equally. Over a year, the number of people sleeping rough will be much higher because of the movement of people on, and off, the streets, and, for example, evidence shows us that women who are rough sleeping are more likely to be hidden from outreach services than men.[2] Despite their limitations, counts and estimates do tell us about trends in the numbers of people visibly rough sleeping in our city and are a consistent measure over time. The ‘snapshot’ street count/estimate approach is also used in North America and Europe; it is one of a range of methods referred to as ‘point-in-time’ counts or estimates.[4]
Critical context to the reduction of people rough sleeping in 2020 is the thousands of people staying in emergency accommodation as a result of the ‘Everyone In’ initiative. The story is that figures are moving in the ‘right direction’, but with a huge amount of resource needed to make this happen. It is also important contextually to note that although the 2020 figure (714) is a reduction, it is still far higher than the equivalent figure from 2010 (446).
Investment and innovation in terms of move on to sustainable, affordable accommodation will be key to maintaining and building on the reduction. A further challenge will be the ongoing flow of new people facing rough sleeping, something commentators feel is potentially set to increase due to factors including the end of the furlough scheme and evictions being resumed after a freeze during the pandemic.
A blog with more analysis will follow the release of the annual CHAIN figures.
Accommodation services
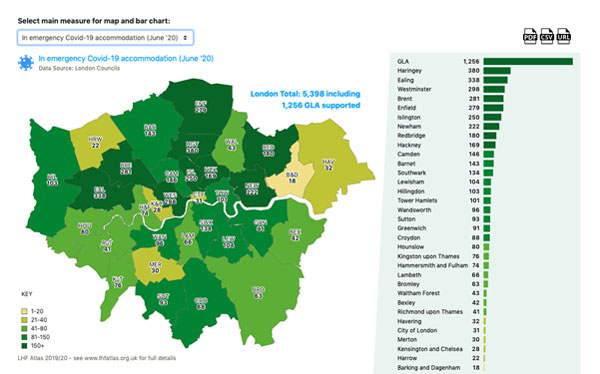
This year we have identified just over 10,000 spaces in accommodation for people with experience of, or at risk of, rough sleeping. This includes hostels and supported housing. My preferred way to view this data is on the infographic – ordering by borough or service provider and by the size of project or number of projects. This figure is a slight increase on just under 9,900 accommodation spaces identified last year.

Last year, as we spoke to services in the Spring, we heard that some were needing to thin out their provision, temporarily reducing capacity, to ensure that people did not have to share facilities between too many people and to create zones for people who were having to self-isolate or were more at risk of serious outcomes from Covid-19. In addition, services were introducing a wide range of new Covid-19 security, such as providing a meal service to rooms, organising in-reach from health services, additional cleaning and encouraging the use of masks and hand sanitiser.
We wondered if this might result in a reduction in spaces when we did the data collection, but this was not the case. The picture of a sustained number of spaces is a testament to the fact that nearly all of the accommodation in the homelessness sector in London, for all its challenges, allows for a level of privacy. Facilities, while often shared, have been managed by staff to ensure infection control and provide safety during the pandemic.
What’s next?
We hope you enjoyed this brief analysis of some of our core Atlas data. Look out for the next blog soon exploring this year’s information about shelters.
If you have ideas or areas about which you would like to know more, we are always pleased to have feedback and suggestions. Contact becky.rice@lhf.org.uk or gareth.thomas@homelesslink.org.uk
===================
1 In March 2020 the government launched its Everyone In initiative putting the onus on local authorities to provide accommodation for people rough sleeping or at risk of rough sleeping in their area; this was to protect people from Covid-19 and reflected a public health approach to homelessness.
2 Housing of Commons Library (2020) Rough sleeping figures: how reliable are they?: https://commonslibrary.parliament.uk/rough-sleeping-statistics-how-reliable-are-they/ (accessed February 2021)
3 St Mungo’s (2018) Women and rough sleeping: a critical review of current research and methodology
4 Smith, A (2015) Can We Compare Homelessness Across the Atlantic? A Comparative Study of Methods for Measuring Homelessness in North America and Europe, University of Montreal:
https://www.feantsa.org/download/smithejh2-2015article10329781340955549685.pdf (accessed March 2021) and OECD, Affordable Housing Database – HC3.1 Homeless Population, Directorate of Employment, Labour and Social Affairs, updated March 2021: https://www.oecd.org/els/family/HC3-1-Homeless-population.pdf (accessed March 2021)